This project uses the Strava API and D3 (Data-Driven Documents) to play around with some examples of D3 visualizations. From Data to Viz is a great resource when trying to pick the best visualization for your data, and also notes some caveats you should try to avoid. You can also find other great examples of D3 products on Observable.
The Bikes
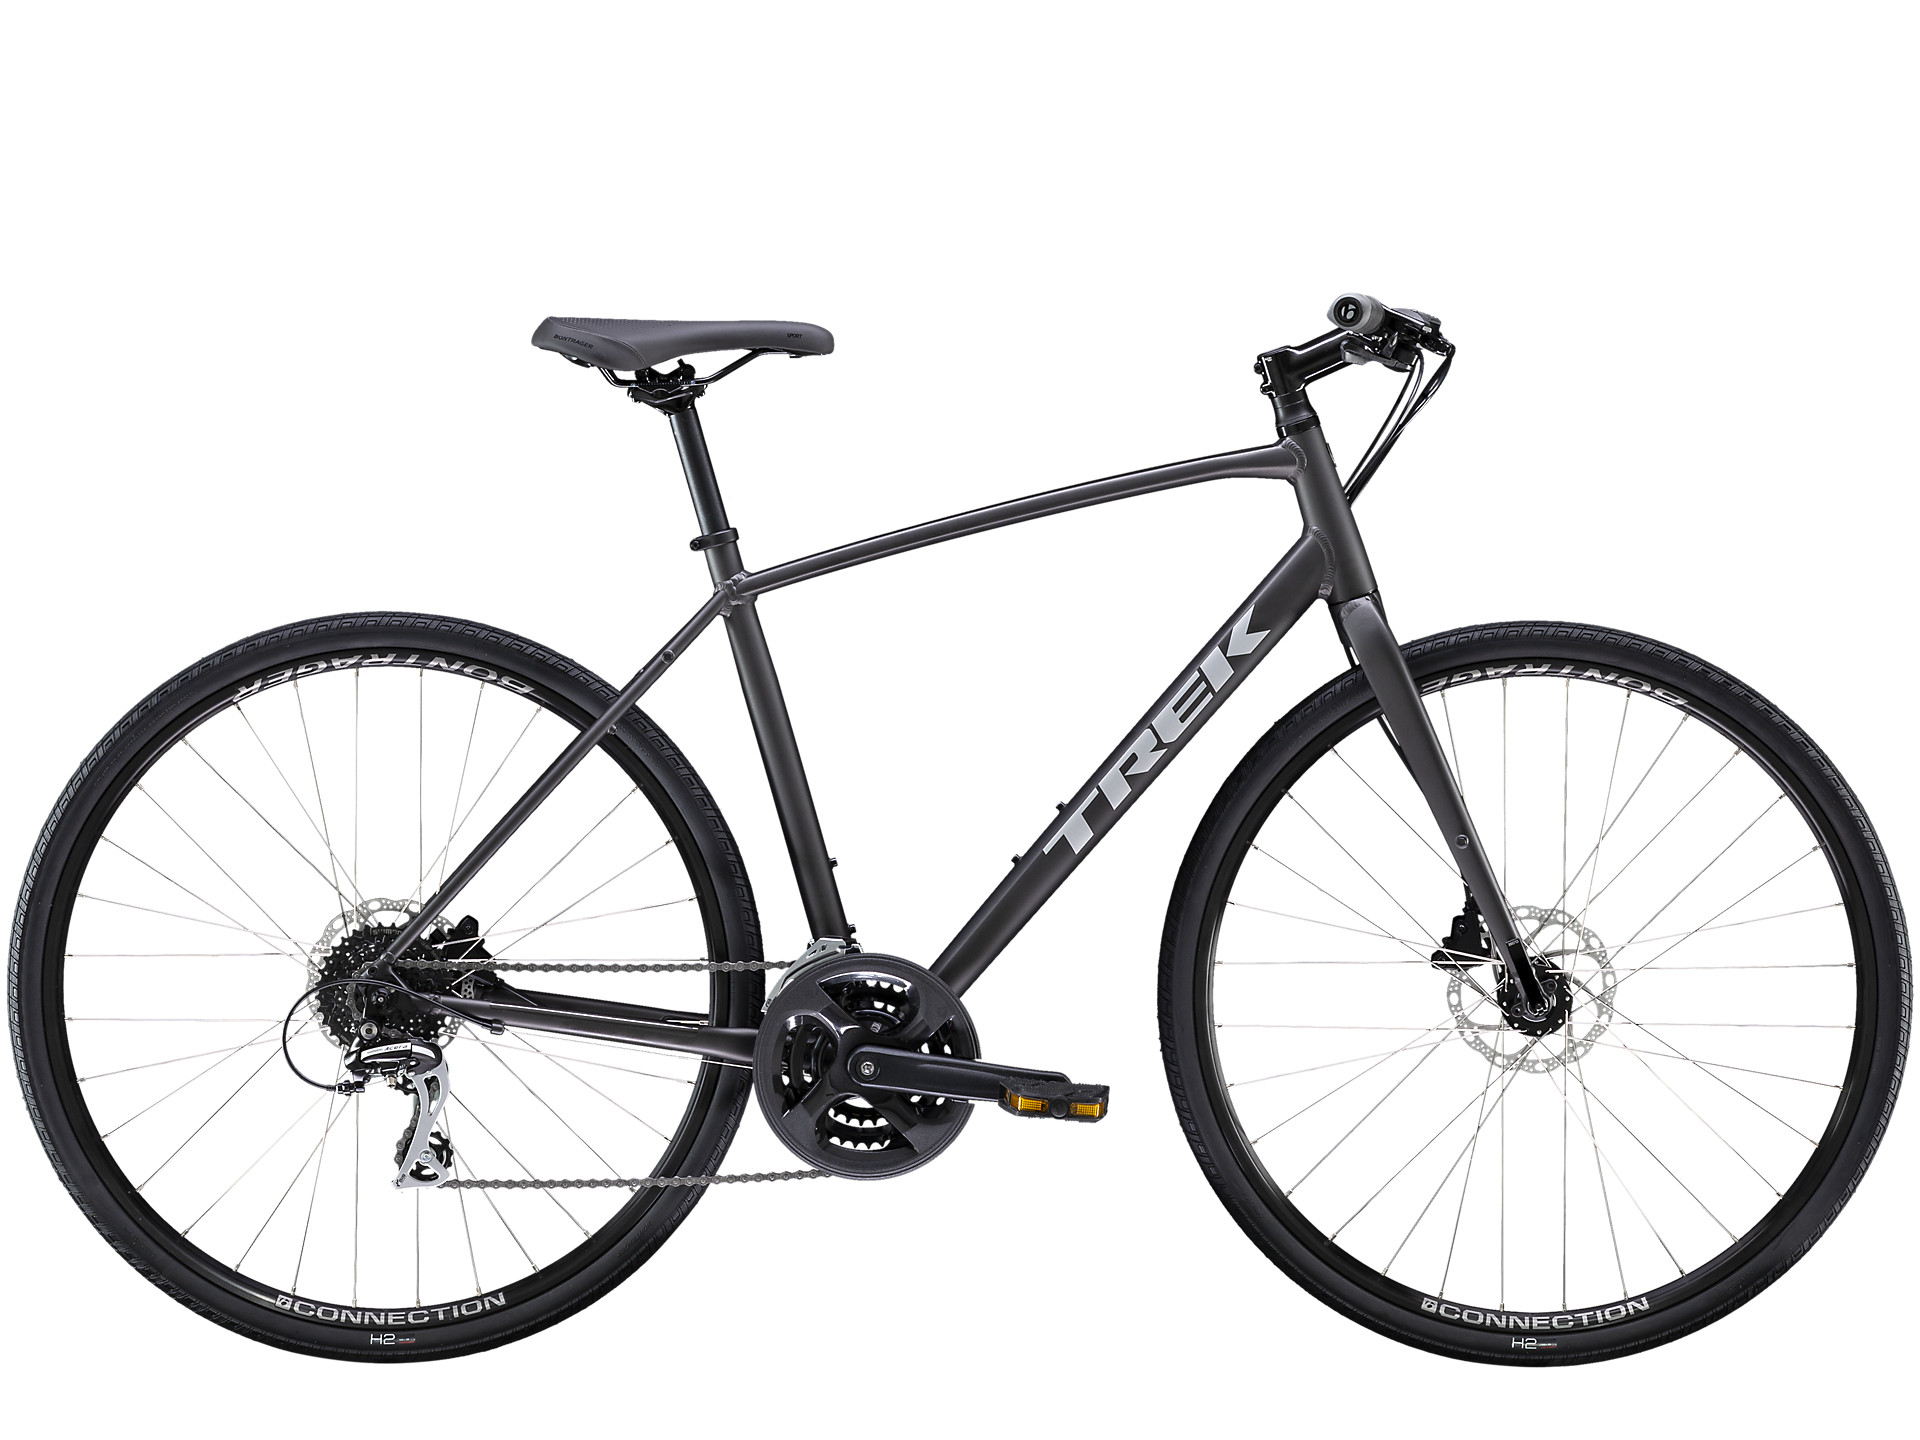
FX 2 Disc is a stylish and versatile hybrid bike with disc brakes that let you stop on a dime and ask for change, even when the weather isn’t cooperating. Train, commute, or ride for fun with the lightweight Alpha Gold Aluminum frame, 24 speeds, and semi-skinny tires that are fast on the road and stable on loose terrain.
Trek fx 2 disc 2021 | Model description

Carbon Offset

I am logging my bike commutes to track my progress in offsetting the Carbon Cost of producing my bike using the Rule of 430. The goal here is to replace 430 miles of commuting, that I would have otherwise driven a car, with biking. Any bike commutes after 430 miles would then be carbon negative! I’ve whipped up a couple of D3 visualizations below to track my progress.
Progress to Carbon Negative | D3 Pie Chart
See Code...// Data Calculations
const carbon_offset_distance = 430;
const commutes = activities_data.filter(data => data['commute'] == true);
const commute_distance = d3.sum(commutes, function(d){
return d.distance;
});
const total_distance = d3.sum(activities_data, function(d){
return d.distance;
});
const data = [{name: 'commuted', value: Math.min(commute_distance, carbon_offset_distance)}, {name: 'remaining', value: Math.max(carbon_offset_distance-commute_distance, 0)}]
// set the dimensions and margins of the graph
var width = 600
height = 450
margin = 40
transition = 250;
// The radius of the pieplot half the smallest dimension
var radius = Math.min(width, height) / 2 - margin
// append the svg object to the div with id 'carbon_offset'
var svg = d3.select("#carbon_offset")
.append("svg")
.attr("width", width)
.attr("height", height)
.append("g")
.attr("transform", "translate(" + width / 2 + "," + height / 2 + ")");
// set the color scale
var color = d3.scaleOrdinal()
.domain(data.map(d => d.value))
.range([colors.commuted, colors.remaining, colors.workout])
// Compute the position of each group on the pie
var pie = d3.pie()
.value(function(d) {return d.value; })
var data_ready = pie(data)
var innerRadius = 100;
// setup functions to handle hover
var mouseover_pie = function(d,i) {
tooltip
.transition()
.duration(transition)
.attr("opacity", '1')
.text(d.value.toFixed(2) + " mi")
.call(wrap, innerRadius);
// dim legend of element not selected
svg.selectAll(".legend-item:nth-of-type("+ new Array(2,1)[i] +")")
.selectAll('*')
.attr("opacity", '0.3')
}
var mouseleave_pie = function(d,i) {
tooltip
.transition()
.duration(transition)
.attr("opacity", '0')
svg.selectAll(".legend-item:nth-of-type("+ new Array(2,1)[i] +")")
.selectAll('*')
.attr("opacity", '1.0')
}
// Build the pie chart
svg.selectAll('path')
.data(data_ready)
.enter()
.append('path')
.attr('d', d3.arc()
.innerRadius(innerRadius) // Size of the donut hole
.outerRadius(radius)
)
.attr('fill', function(d){ return(color(d.value)) })
.style("opacity", 0.7)
.style('cursor', 'pointer')
.on("mouseover", mouseover_pie)
.on("mouseleave", mouseleave_pie)
var tooltip = svg.append("text")
.attr('class', 'tooltip')
.style("z-index", "10")
.attr("cx", width/2)
.attr("cy", height/2)
.attr("dy", "0.5em")
.style("text-anchor", "middle")
.attr("font-size", "20px")
.attr("opacity", '0')
// Add Legend
var legend = svg.selectAll('circle')
.data(data)
.enter()
.append("g")
.attr("class","legend-item")
legend.append('circle')
.attr("cx",200)
.attr("cy",function(d,i){
return 130 + i*30;
})
.attr("r", 6)
.style("fill", function(d,i){
return colors[d.name];
})
legend.append("text")
.attr("x", 220)
.attr("y", function(d,i){
return 130 + i*30;
})
.text(function(d,i){
return d.name.toTitleCase();
})
.style("font-size", "15px")
.attr("alignment-baseline","middle")| Date | Trip | Distance |
|---|
//add data to table
const table = document.getElementById("commute_table");

commutes.forEach(function(d) {
  var row = table.insertRow(-1);

  var date_cell = row.insertCell(0);
  var name_cell = row.insertCell(1);
  var distance_cell = row.insertCell(2);

  date_cell.innerHTML = d.start_date_local.split("T")[0];
  name_cell.innerHTML = d.name;
  distance_cell.innerHTML = d.distance.toFixed(2);
});

var row = table.insertRow(-1);
var date_cell = row.insertCell(0);
var name_cell = row.insertCell(1);
var distance_cell = row.insertCell(2);

date_cell.innerHTML = "------------";
name_cell.innerHTML = "Carbon Offset Mileage Remaining";
distance_cell.innerHTML = Math.max(carbon_offset_distance - commute_distance,0).toFixed(2);
Strava Dashboard | D3
See Code...var margin = {top: 60, right: 20, bottom: 40, left: 50},
padding = 5;
width = 600, // set width to viewport width
height = 400;
//xScale
const xScale = d3.scaleBand() //Ordinal scale
.domain(d3.range(activities_data.length)) //input domain for the scale
.rangeRound([margin.left, width-margin.right]) //enables rounding of the range
.paddingInner(0.01); //spacing between each bar
//yScale
const yScale = d3.scaleLinear()
.domain([
d3.max( // largest data value in dataset
activities_data.map(function(d){ return d.distance }) // map distance values to array
),
0 // min is 0
])
.range([margin.top, height]); // margin.top as min value (top) so we have space for labels
//Create SVG element
const activities_svg = d3.select("#activities_chart")
.append("svg")
.attr("width", width + margin.left + margin.right)
.attr("height", height + margin.top + margin.bottom);
// set the color scale
var color = d3.scaleOrdinal()
.domain([true, false])
.range([colors.commuted, colors.workout]);
// functions that show the tooltip when user hovers / leaves a cell
var mouseover = function(d) {
var txt = d3.select(this.nextSibling);
txt.attr('opacity', '1');
}
var mouseleave = function(d) {
var txt = d3.select(this.nextSibling);
txt.attr('opacity', '0');
}
//create bars wrapper (do this for the tooltip)
var bars = activities_svg.selectAll(".bar")
.data(activities_data)
.enter()
.append("g");
//Create bars
bars
.append("rect")
.attr("x", function(d, i) { // position in x-axis
return xScale(i); // index from the dataset
})
.attr("y", function(d) {
return yScale(d.distance);
})
.attr("width", xScale.bandwidth()) // bandwith of the scale
.attr("height", function(d) {
return height - yScale(d.distance); // remember height is actually the bottom of svg
})
.attr('fill', function(d){ return(color(d.commute)) })
.style('cursor', 'pointer')
.on("mouseover", mouseover)
.on("mouseleave", mouseleave)
bars
.append("text")
.attr('class', 'tooltip')
.style("z-index", "10")
.attr("x", function(d,i) { return xScale(i)+xScale.bandwidth()/2; }) // scale to bars
.attr("y", function(d) { return yScale(d.distance) - xScale.bandwidth()/2 ; })
.style("text-anchor", "middle")
.attr("font-size", xScale.bandwidth()+"%")
.attr("opacity", '0')
.text(function(d) {
return d.start_date_local.split("T")[0] + " " + d.distance.toFixed(2) + " mi"
})
.call(wrap, xScale.bandwidth());
// Draw the y-axis
activities_svg
.append("g")
.attr("transform", "translate("+margin.left+",0)") // position of the Axis
.call(d3.axisLeft(yScale)
.tickSizeOuter(0) // remove outer tick
)
.select(".domain").remove() // remove the main bar of axis
// Draw the x-axis
activities_svg
.append("g")
.attr("transform", "translate(0,"+height+")") // position of the Axis
.call(d3.axisBottom(xScale)
.tickSizeOuter(0) // remove outer tick
.tickFormat(function(d,i){ return i+1 }) // shift tick values to start at 1
)
.select(".domain").remove() // remove the main bar of axis
// Add X axis label:
activities_svg
.append("text")
.attr("text-anchor", "end")
.attr("x", (width/2)+margin.left)
.attr("y", height + margin.bottom)
.text("Bike Rides");
// Y axis label:
activities_svg
.append("text")
.attr("text-anchor", "end")
.attr("transform", "rotate(-90)")
.attr("x", -(height/2))
.attr("y", margin.left/2-padding)
.text("Miles")
// append the svg object to the elevation_chart
var elevation_svg = d3.select("#elevation_chart")
  .append("svg")
    .attr("width", width + margin.left + margin.right)
    .attr("height", height + margin.top + margin.bottom)


// add X axis
var x = d3.scalePoint()
  .domain(d3.range(activities_data.length))
  .range([margin.left, width-margin.right]);

elevation_svg.append("g")
  .attr("transform", "translate(0," + height + ")")
  .call(d3.axisBottom(x)
    .tickFormat(function(d,i){ return i+1 })
  );

// Add Y axis
var y = d3.scaleLinear()
  .domain([0, d3.max(activities_data, function(d) { return d.total_elevation_gain; })])
  .range([height, margin.top]);

elevation_svg.append("g")
.attr("transform", "translate("+margin.left+",0)")
  .call(d3.axisLeft(y));


// Add the line
elevation_svg.append("path")
  .datum(activities_data)
  .attr("fill", "none")
  .attr("stroke", "steelblue")
  .attr("stroke-width", 1.5)
  .attr("d", d3.line()
        .x(function(d,i) {
            return x(i)
        })
        .y(function(d) {
            return y(d.total_elevation_gain)
        })
    )

// Add X axis label:
elevation_svg.append("text")
    .attr("text-anchor", "end")
    .attr("x", (width/2)+margin.left)
    .attr("y", height + margin.top/2+padding)
    .text("Bike Rides");

// Y axis label:
elevation_svg.append("text")
    .attr("text-anchor", "end")
    .attr("transform", "rotate(-90)")
    .attr("y", margin.left/2 - padding)
    .attr("x", -(height/2)+margin.top)
    .text("Total Elevation Gain (Ft)")
Stuck it out, eh?
Interested in checking out some other projects? Take a look at the rest of my D3 portfolio, or Data Visualization portfolio more broadly.